注釈
クリック here 完全なサンプルコードをダウンロードします
FITSファイルから画像を読み出して印刷する
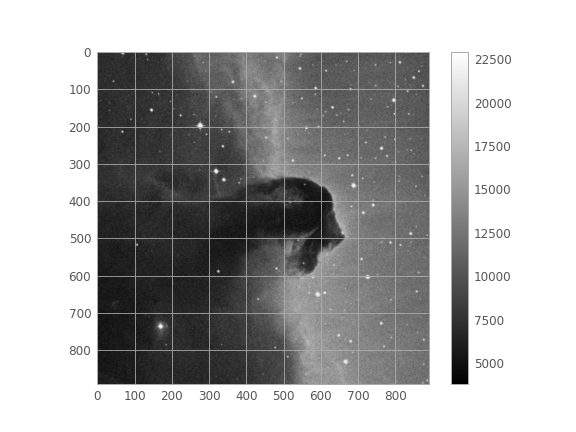
この例では、FITSファイルに格納されている画像を開いて画面に表示する。
この例で使用する astropy.utils.data このファイルをダウンロードするには astropy.io.fits このファイルを開いて matplotlib.pyplot 画像を表示する場合は、以下の操作を実行してください。
By: Lia R. Corrales, Adrian Price-Whelan, Kelle Cruz
ライセンス:BSD
Matplotlibを設定し、より良い描画パラメータのセットを使用する
import matplotlib.pyplot as plt
from astropy.visualization import astropy_mpl_style
plt.style.use(astropy_mpl_style)
この例で使用される例示FITSファイルをダウンロードします:
from astropy.utils.data import get_pkg_data_filename
from astropy.io import fits

image_file = get_pkg_data_filename('tutorials/FITS-images/HorseHead.fits')
使用 astropy.io.fits.info() ファイルの構造を表示するには、以下の操作を実行してください。
出て:
Filename: /home/bk/.astropy/cache/download/url/ff6e0b93871033c68022ca026a956d87/contents
No.    Name      Ver    Type      Cards   Dimensions   Format
  0  PRIMARY       1 PrimaryHDU     161   (891, 893)   int16
  1  er.mask       1 TableHDU        25   1600R x 4C   [F6.2, F6.2, F6.2, F6.2]
一般に、画像情報は、マスタHDUに位置し、子機0とも呼ばれる。ここでは astropy.io.fits.getdata() この第1の拡張モジュールからキーワードパラメータを用いて画像データを読み出すには、以下の操作を実行してください ext=0 :
image_data = fits.getdata(image_file, ext=0)
データは現在,2次元Numpy配列として格納されている.形状属性を使用してサイズを印刷する:
print(image_data.shape)
出て:
(893, 891)
表示画像データ:
plt.figure()
plt.imshow(image_data, cmap='gray')
plt.colorbar()

出て:
/pb1/rst_repos/git/astropy/examples/io/plot_fits-image.py:58: MatplotlibDeprecationWarning: Auto-removal of grids by pcolor() and pcolormesh() is deprecated since 3.5 and will be removed two minor releases later; please call grid(False) first.
  plt.colorbar()

<matplotlib.colorbar.Colorbar object at 0x7feda3324668>
スクリプトの総実行時間: (0分0.200秒)