MatplotlibにAstropyオブジェクトを描画する
土方量を描く
Quantity Matplotlibを用いてオブジェクトを容易に印刷することができる。この機能は明確に開く必要があります:
>>> from astropy.visualization import quantity_support
>>> quantity_support()
<astropy.visualization.units.MplQuantityConverter ...>
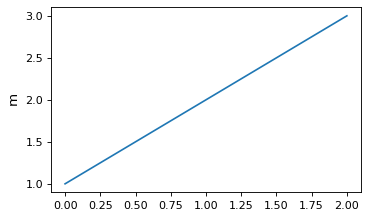
それは Quantity オブジェクトはmatplotlib描画関数に渡すことができる.軸ラベルは自動的に数単位でマークされる:
from astropy import units as u
from astropy.visualization import quantity_support
quantity_support()
from matplotlib import pyplot as plt
plt.figure(figsize=(5,3))
plt.plot([1, 2, 3] * u.m)

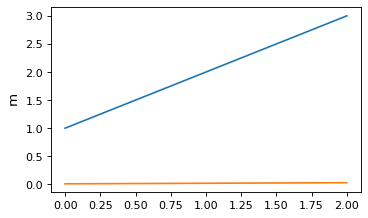
数は特定の軸に設けられた最初の単位に自動的に変換されるので、以下、y軸は m 2行目を与えても cm :
plt.plot([1, 2, 3] * u.cm)

互換性のない単位描画数を使用すると異常を引き起こす。例えば、呼び出し plt.plot([1, 2, 3] * u.kg) (品質単位)長さ単位が表示された印刷に重畳する。
後に設備サポートをオフにすることを確認するためには、ご利用いただけます quantity_support 1つを使う with 声明:
with quantity_support():
    plt.plot([1, 2, 3] * u.m)
描画時間.
Matplotlib自体は、前述したように、1つまたは2つの軸上に日付および時間を描画する機構を提供する Date tick labels それがそうです。これを利用するには、ご利用いただけます plot_date 属性 Time Matplotlibで使用した時間システムにおける値を得る.
しかし、多くの場合、目盛りラベルの使用の正確な割合とフォーマットをより多く制御することが望ましいかもしれません。この場合、使用することができます。 time_support 機能します。この機能は明確に開く必要があります:
>>> from astropy.visualization import time_support
>>> time_support()
<astropy.visualization.units.MplTimeConverter ...>
この機能を有効にすると Time オブジェクトはmatplotlib描画関数に渡すことができる.そして,軸ラベルは自動的に時間,時間フォーマットが付与されて使用される. Time クラス:
from matplotlib import pyplot as plt
from astropy.time import Time
from astropy.visualization import time_support

time_support()

plt.figure(figsize=(5,3))
plt.plot(Time([58000, 59000, 62000], format='mjd'), [1.2, 3.3, 2.3])
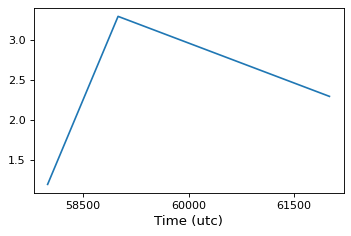

デフォルトの場合,描画に用いるフォーマットと割合は,Matplotlibが特定の軸インスタンスに初めて遭遇したときのフォーマットと割合をとる.フォーマットや割合はパラメータを渡すことで time_support :
time_support(format='mjd', scale='tai')
plt.figure(figsize=(5,3))
plt.plot(Time([50000, 52000, 54000], format='mjd'), [1.2, 3.3, 2.3])
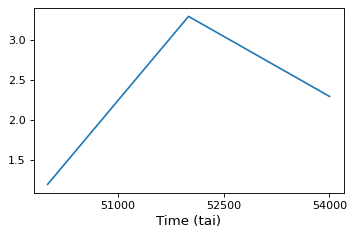

その後の印刷時間のサポートをオフにするためには、ご利用いただけます time_support シナリオ管理者として:
with time_support(format='mjd', scale='tai'):
    plt.figure(figsize=(5,3))
    plt.plot(Time([50000, 52000, 54000], format='mjd'))