世界座標初期化軸を用いて
基本初期化
以下のツールを用いて描画を作成するには、以下の操作を実行してください WCSAxes, we first read in the data using astropy.io.fits WCS情報を解析する.本例では、http://data.astterpy.orgサーバからの例示FITSファイル(http://data.asterpy.orgサーバ)を使用する get_pkg_data_filename() 関数はファイルをダウンロードしてファイル名を返す):
from astropy.wcs import WCS
from astropy.io import fits
from astropy.utils.data import get_pkg_data_filename

filename = get_pkg_data_filename('galactic_center/gc_msx_e.fits')

hdu = fits.open(filename)[0]
wcs = WCS(hdu.header)
そしてMatplotlibを使って図形を作成し WCS 上で作成されたオブジェクトです。以下の例は、Axesオブジェクトへの参照を保持しながら、Matplotlib‘pylot’インターフェースを使用してこの動作を実行する方法を示す。
import matplotlib.pyplot as plt
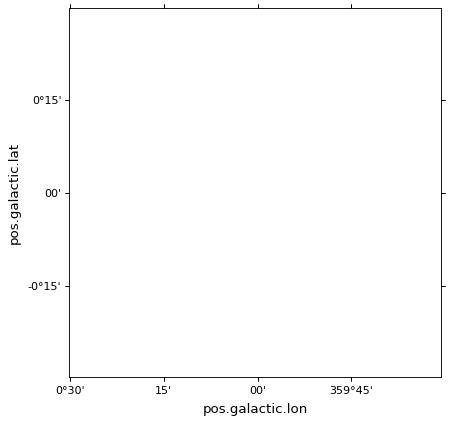
ax = plt.subplot(projection=wcs)
♪the ax 作成の対象は WCSAxes 級友たち。WCS変換が指定されていない場合、変換はデフォルトでIdentityとなり、これは、世界座標が画素座標に一致することを意味することに留意されたい。
標準matplotlib軸の場合、示される視野は、画素座標において両方の方向において0~1である。画像が表示されると(参照) 画像と等高線を描く )は、制限を調整しますが、必要であれば、手動で制限を調整することもできます。調整制約は,通常のMatplotlib描画と同じ関数/方法を用いる:
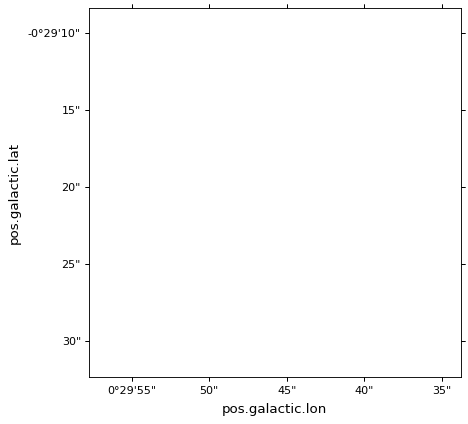
ax.set_xlim(-0.5, hdu.data.shape[1] - 0.5)
ax.set_ylim(-0.5, hdu.data.shape[0] - 0.5)
注釈
Pylotインタフェースを用いれば,置き換えることも可能である. ax.set_xlim そして ax.set_ylim vt.から. plt.xlim そして plt.ylim それがそうです。
選択可能な方法
Matplotlibのように実際に初期化できる方法はいくつかあります WCSAxes それがそうです。
以上のように,最も簡単な方法は利用である. WCS 分類して伝えることができます plt.subplot それがそうです。Matplotlibのオブジェクト指向インタフェースを一般的に使用する場合、以下の動作を実行することもできます。
fig = plt.figure()
ax = fig.add_subplot(1, 1, 1, projection=wcs)
これはこれにも適用されます add_axes() そして axes() 例えば、:
ax = fig.add_axes([0.1, 0.1, 0.8, 0.8], projection=wcs)
あるいは:
plt.axes([0.1, 0.1, 0.8, 0.8], projection=wcs)
Any additional arguments passed to
add_subplot(),
add_axes(),
subplot(), or axes(), such
as slices or frame_class, will be passed on to the
WCSAxes class.
WCSAxを直接初期化します
上記の初期化方法の代替方法として WCSAxes 現実化することもできます WCSAxes これを直接図に追加します:
from astropy.wcs import WCS
from astropy.visualization.wcsaxes import WCSAxes
import matplotlib.pyplot as plt

wcs = WCS(...)

fig = plt.figure()
ax = WCSAxes(fig, [0.1, 0.1, 0.8, 0.8], wcs=wcs)
fig.add_axes(ax)  # note that the axes have to be explicitly added to the figure