カスタムフレームワークを使用する
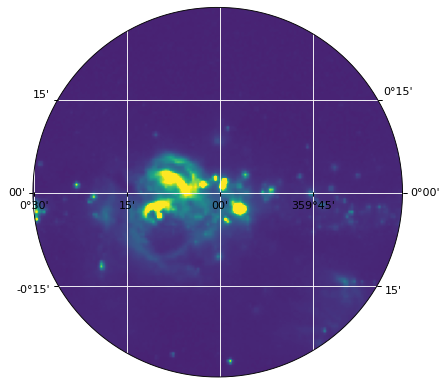
デフォルトの場合、 WCSAxes 矩形フレームを用いて描画を行うが,任意のカスタムフレームを提供するように変更することができる.以下の例では、内蔵の使用方法を示す EllipticalFrame クラスは、内蔵矩形フレームと同じ制約に拡張された楕円である。
from astropy.wcs import WCS
from astropy.io import fits
from astropy.utils.data import get_pkg_data_filename
from astropy.visualization.wcsaxes.frame import EllipticalFrame
import matplotlib.pyplot as plt

filename = get_pkg_data_filename('galactic_center/gc_msx_e.fits')
hdu = fits.open(filename)[0]
wcs = WCS(hdu.header)

ax = plt.subplot(projection=wcs, frame_class=EllipticalFrame)

ax.coords.grid(color='white')

im = ax.imshow(hdu.data, vmin=-2.e-5, vmax=2.e-4, origin='lower')

# Clip the image to the frame
im.set_clip_path(ax.coords.frame.patch)
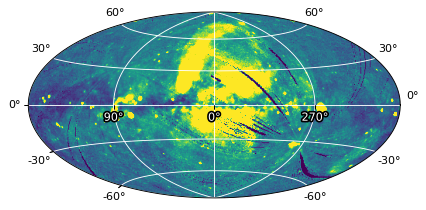
♪the EllipticalFrame クラスは、Aitoff投影のような全空印刷に特に有用である:
from astropy.wcs import WCS
from astropy.io import fits
from astropy.utils.data import get_pkg_data_filename
from astropy.visualization.wcsaxes.frame import EllipticalFrame
from matplotlib import patheffects
import matplotlib.pyplot as plt

filename = get_pkg_data_filename('allsky/allsky_rosat.fits')
hdu = fits.open(filename)[0]
wcs = WCS(hdu.header)

ax = plt.subplot(projection=wcs, frame_class=EllipticalFrame)

path_effects=[patheffects.withStroke(linewidth=3, foreground='black')]
ax.coords.grid(color='white')
ax.coords['glon'].set_ticklabel(color='white', path_effects=path_effects)

im = ax.imshow(hdu.data, vmin=0., vmax=300., origin='lower')

# Clip the image to the frame
im.set_clip_path(ax.coords.frame.patch)
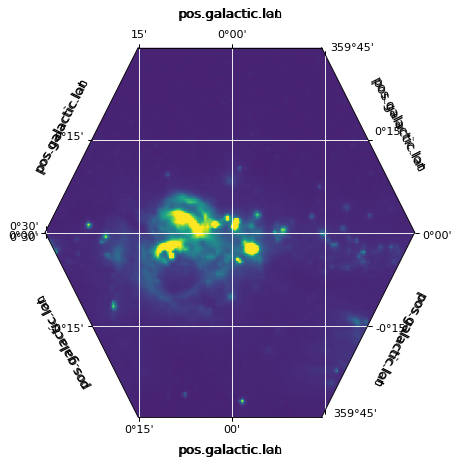
しかし、あなたはまた自分のFrame類を書くことができます。その考え方は,任意の数の定義フレームを設けた連結脊椎である.フレームを脊椎と定義することができるが,複数の脊椎と定義すれば,目盛りラベルと目盛りがどの脊椎に表示されるべきかを制御することができる.
以下の例は、六角形フレームをどのように定義するかを示す。
import numpy as np
from astropy.visualization.wcsaxes.frame import BaseFrame

class HexagonalFrame(BaseFrame):

    spine_names = 'abcdef'

    def update_spines(self):

        xmin, xmax = self.parent_axes.get_xlim()
        ymin, ymax = self.parent_axes.get_ylim()

        ymid = 0.5 * (ymin + ymax)
        xmid1 = (xmin + xmax) / 4.
        xmid2 = (xmin + xmax) * 3. / 4.

        self['a'].data = np.array(([xmid1, ymin], [xmid2, ymin]))
        self['b'].data = np.array(([xmid2, ymin], [xmax, ymid]))
        self['c'].data = np.array(([xmax, ymid], [xmid2, ymax]))
        self['d'].data = np.array(([xmid2, ymax], [xmid1, ymax]))
        self['e'].data = np.array(([xmid1, ymax], [xmin, ymid]))
        self['f'].data = np.array(([xmin, ymid], [xmid1, ymin]))
そしてそれを使うことができます
from astropy.wcs import WCS
from astropy.io import fits
from astropy.utils.data import get_pkg_data_filename
import matplotlib.pyplot as plt

filename = get_pkg_data_filename('galactic_center/gc_msx_e.fits')
hdu = fits.open(filename)[0]
wcs = WCS(hdu.header)

ax = plt.subplot(projection=wcs, frame_class=HexagonalFrame)

ax.coords.grid(color='white')

im = ax.imshow(hdu.data, vmin=-2.e-5, vmax=2.e-4, origin='lower')

# Clip the image to the frame
im.set_clip_path(ax.coords.frame.patch)

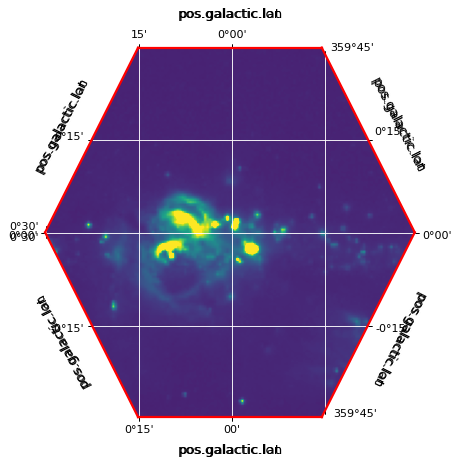
フレーム属性
枠の色や線幅は以下のように設定することもできます
ax.coords.frame.set_color('red')
ax.coords.frame.set_linewidth(2)