カスタム変換を使用したWCSAXの初期化
はい。 世界座標初期化軸を用いて 私たちはどのように使うかを見ました WCS 物体です。しかし、 WCSAxes クラスはより汎用的な変換を用いて初期化することも可能であり,これらの変換は WCS 級友たち。逆に、初期化することができます WCSAxes Matplotlibを使って Transform 対象と辞書 (coord_meta )は、変換をどのように解釈するかに関するメタデータを提供する。
♪the Transform 画素から世界座標への変換を表し、持つべきである input_dims=2 持っていることができます output_dims 任意の正の整数に設定する.他にも、 has_inverse 設定すべきは True そして inverted 方法は実現すべきだ。
♪the coord_meta 辞書には以下のキーワードが含まれるべきである:
name:各次元名の文字列を与える反復可能type: an iterable of strings that should be either'longitude','latitude', or'scalar'(for anything that isn't a longitude or latitude).wrap:値の繰り返し値は、経度改行座標の角度(度単位)を示す。これは…。Noneそうでない限りtypeはい。'longitude'それがそうです。format_unit:反復可能なUnitタグフォーマットの単位を設定するためのオブジェクトを提供する。これらを設定することができますNoneデフォルト使用で与えられた単位は、以下の操作を実行してくださいunitしかし、例えば、Transform度単位で返却値を設定し、ラベルを時間単位でフォーマットしたいと思います。
また、 coord_meta 以下の鍵を含むことを選択することができる:
default_axislabel_position:世界ごとに提供される文字列の反復座標フレームの脊椎であり,そのフレーム上に座標の軸ラベルを表示する.各文字列は以下の入力として利用できるはずであるset_axislabel_position()それがそうです。default_ticklabel_position:世界ごとに指定された文字列の反復座標フレームの脊椎は,そのフレーム上に座標の目盛りラベルを表示する.各文字列は以下の入力として利用できるはずであるset_ticklabel_position()それがそうです。default_ticks_position:世界ごとに提供される文字列の反復座標フレームの脊椎は,そのフレーム上に座標の目盛りを表示する.各文字列は以下の入力として利用できるはずであるset_ticks_position()それがそうです。
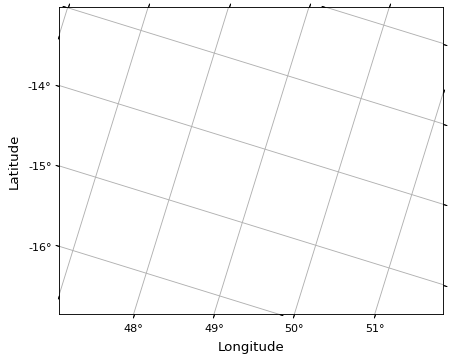
以下の例は、変換および使用を説明するためのものである。 coord_meta :
from astropy import units as u
import matplotlib.pyplot as plt
from matplotlib.transforms import Affine2D
from astropy.visualization.wcsaxes import WCSAxes

# Set up an affine transformation
transform = Affine2D()
transform.scale(0.01)
transform.translate(40, -30)
transform.rotate(0.3)  # radians

# Set up metadata dictionary
coord_meta = {}
coord_meta['name'] = 'lon', 'lat'
coord_meta['type'] = 'longitude', 'latitude'
coord_meta['wrap'] = 180, None
coord_meta['unit'] = u.deg, u.deg
coord_meta['format_unit'] = None, None

fig = plt.figure()
ax = WCSAxes(fig, [0.1, 0.1, 0.8, 0.8], aspect='equal',
             transform=transform, coord_meta=coord_meta)
fig.add_axes(ax)
ax.set_xlim(-0.5, 499.5)
ax.set_ylim(-0.5, 399.5)
ax.grid()
ax.coords['lon'].set_axislabel('Longitude')
ax.coords['lat'].set_axislabel('Latitude')
